
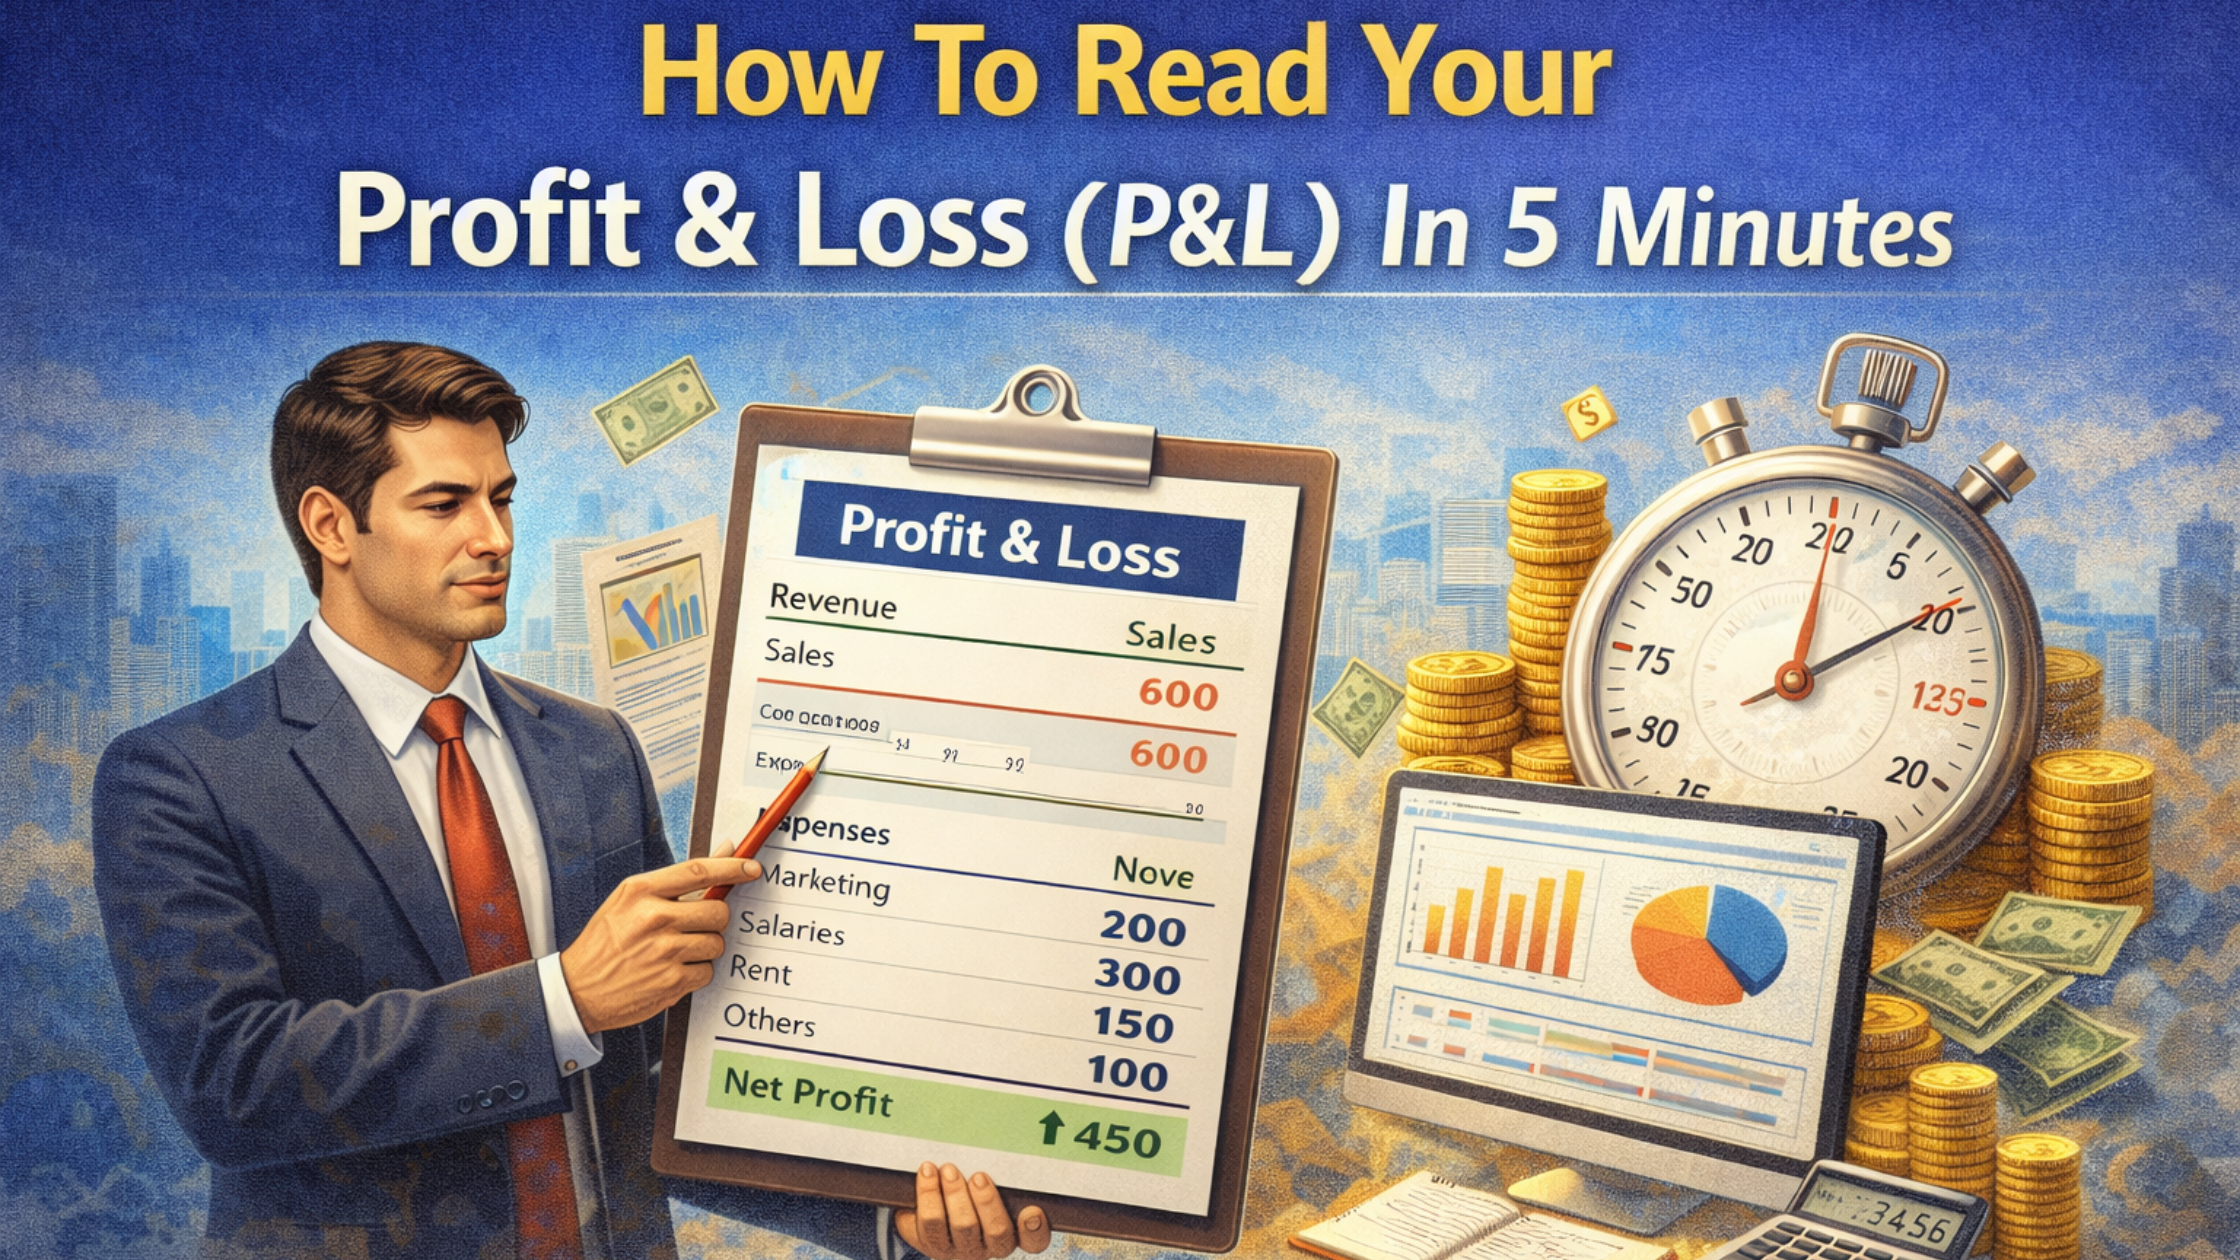
How To Read Your Profit & Loss (P&L) In 5 Minutes
Every business’s P&L (income statement) is its financial report card. In just a glance, it shows where your money comes from and where it goes, helping you spot wins and problems immediately. For busy SME founders and finance managers, learning to scan the P&L quickly is crucial. Each line item – from Sales (Revenue) down to Net Profit – tells a story about sales, costs, and profitability. (Specialized advisors, like corporate finance consulting firms or CA firms in Chennai, can help you interpret this story and make strategic decisions.) Below we break down each P&L section with clear examples that Indian SMEs can relate to.
Sales (Revenue)
Top line: revenue is the total sales your company makes in the period. It is not profit – it’s the raw cash coming in from customers. For example, if a small clothing store sells 100 shirts at ₹500 each in a month, its revenue is ₹50,000. A growing revenue means more business; a decline signals trouble. Always compare revenue to past periods or targets. (As one guide advises, compare to last month or last year to spot trends.) Revenue trends show whether demand is rising or falling. If sales drop unexpectedly, investigate quickly – maybe a new competitor or a marketing gap. Conversely, strong revenue growth can give an SME the confidence to hire staff or expand product lines.
Cost Of Goods Sold (COGS)
Direct costs: COGS are the costs directly tied to your products or services. For a manufacturer, this includes raw materials and direct labor. For a retailer, COGS is the purchase price of goods sold. For instance, if that clothing store bought 100 shirts from its supplier at ₹300 each, COGS is ₹30,000. Deducting COGS from revenue gives Gross Profit (next section). A key metric is COGS as a percentage of revenue: a rising percentage means costs are creeping up relative to sales. This often signals the need to adjust pricing or find cheaper suppliers. For example, if COGS jumps to ₹400 per shirt (40% of revenue instead of 30%), profit margins shrink. SME owners should track COGS closely and look for ways to negotiate better input costs or optimize production.
Gross Profit
Revenue minus COGS: Gross profit is what’s left after covering direct costs. In our example, ₹50,000 revenue minus ₹30,000 COGS leaves ₹20,000 gross profit. Gross profit is the cash available to cover all other expenses. It reveals how efficiently you produce or source your goods. The gross profit margin (gross profit ÷ revenue) is especially telling. A high margin means strong pricing or low production costs. A low margin could mean over-spending on materials or underpricing. For example, if a cafe sells coffee and its gross margin is only 20%, it might be time to raise prices or buy beans in bulk. Regularly reviewing gross profit helps SME managers adjust product mix or cost controls.
Overhead Expenses
Indirect costs: After gross profit comes the overhead or operating expenses (often called SG&A). These include everything not directly tied to production: office rent, utilities, marketing, employee salaries (non-production), legal and accounting fees, depreciation on equipment, and so on. For our clothing store, overhead could be shop rent, staff wages (the salespeople), electricity, and advertising costs. These are largely fixed or semi-variable. For example:
- Rent & utilities: Store or office space, electricity, water.
- Payroll (non-production): Sales staff, managers, HR.
- Marketing/advertising: Online ads, print flyers.
- Admin costs: Accounting, software subscriptions, insurance.
Even if sales dip or surge, many overheads remain similar month-to-month. Managing overhead is critical: uncontrolled overhead can wipe out profits even if gross profit is healthy. Business owners should list and review major overhead items (often 3–5 big ones make up the bulk) and look for savings – for example, moving to a smaller office, negotiating ad rates, or automating admin tasks.
Operating Profit (EBITDA)
Profit from core operations: Operating profit – often shown as EBITDA (Earnings Before Interest, Taxes, Depreciation and Amortization) – is gross profit minus overhead. It represents the profit from day-to-day business, before accounting for financing and taxes. For instance, if gross profit is ₹20,000 and overheads total ₹15,000, operating profit is ₹5,000. (Strictly speaking, EBITDA also adds back depreciation/amortization to this figure.) This is a key measure of operational health. A positive operating profit indicates the core business is viable; a negative number is a red flag. Operating profit (EBITDA) lets SMEs compare performance across months or with peers by focusing on core profitability. If EBITDA is shrinking, owners might cut costs or improve processes. If it’s strong, they might reinvest, such as hiring extra sales staff or launching a new product.
Net Profit
Bottom line: Net profit (net income) is what remains after all expenses, interest and taxes. Continuing our example, if the ₹5,000 operating profit faces ₹500 interest or bank fees and ₹1,000 taxes, net profit would be ₹3,500. Net profit is the ultimate measure of profitability. It shows how much the business earned for owners or shareholders during the period. SME owners use net profit to fund future growth (reinvesting in equipment or expansion) or take dividends. Consistent net profit is vital for long-term survival. If net profit falls below zero, even a small business must take action — perhaps by raising prices, cutting discretionary costs, or restructuring debt. (Note: Some businesses may temporarily accept low net profit to fund growth or tax strategies, but this should be a deliberate plan.)
Cash Vs Profit
Profit ≠ Cash: Finally, remember that profit on paper is not always the same as cash in hand. Profit is based on revenues and expenses as they accrue (including credit sales or credit purchases), whereas cash flow tracks actual money moving in and out. For example, your business might show ₹10,000 profit for the month, but if most sales were on 30-day credit and you had to prepay ₹8,000 of expenses, cash in the bank could be low. A company can be profitable but still run out of cash (e.g. if receivables pile up). Conversely, one might have healthy cash flow (from borrowing or selling assets) but be unprofitable. To avoid surprises, SME leaders should routinely compare the P&L with the cash flow statement. Key differences often include:
- Timing of payments: Sales made on credit (cash is delayed) or purchases paid upfront (cash out before expense hits P&L).
- Non-cash items: Depreciation reduces profit but doesn’t use cash that period.
- Investments and financing: Taking a loan or buying equipment affects cash, not profit.
Understanding “cash vs profit” helps businesses plan for taxes, debt, and growth. For instance, even with profit, a business might need a working capital loan to bridge gaps (a common practice advised by corporate finance consultants).
Frequently Asked Questions (FAQ)
1. What is a Profit & Loss (P&L) statement?
A P&L statement shows a business’s revenues, expenses, and profit over a specific period.
2. Why should I learn to read a P&L?
Reading a P&L helps you understand profitability, control costs, and make better business decisions quickly.
3. What are the main parts of a P&L?
The key sections are:
• Revenue (Sales)
• Cost of Goods Sold (COGS)
• Gross Profit
• Operating Expenses
• Net Profit
4. Can I read a P&L in just 5 minutes?
Yes — by focusing on the top-line revenue, major expense categories, and net profit, you can assess financial performance fast.
5. What’s the difference between gross profit and net profit?
• Gross Profit: Revenue minus direct costs (COGS).
• Net Profit: Profit after all expenses, including operating and non-operating costs.
6. How often should I review my P&L?
Ideally monthly, so you can track trends and take action quickly.
Conclusion: Financial Literacy Fuels Growth
Reading the P&L effectively turns raw numbers into action. For SME founders and finance managers, knowing each line – from Sales at the top to Net Profit at the bottom – provides clarity on performance and points to the right decisions. Regular P&L review helps you spot rising costs early (e.g. an exploding COGS or overhead), adjust pricing or strategy, and forecast needs (like building cash reserves for tax payments). Financial literacy empowers smarter budgeting, pricing, and investment choices. If the P&L ever seems confusing, remember: expert help is available. Partnering with professional advisors – such as seasoned corporate finance consulting firms or specialist CA firms in Chennai – can demystify your reports. These experts can analyze your P&L, highlight areas to improve, and guide strategic planning. In the end, well-interpreted P&Ls help SMEs grow sustainably: they show where profit is made, where cash is needed, and how to strengthen the business for the future
Also read: