
- The EBITDA Question That Can Mislead An Investor
- First, Understand The Business Model
- Why Traditional EBITDA Analysis Can Be Misleading For Lenders
- 1. Interest Is Not Simply A Financing Cost
- 2. Credit Cost Is An Economic Cost Of Lending
- 3. Capital Adequacy Changes The Growth Equation
- 4. The Balance Sheet Is The Operating Engine
- The Metrics Investors Should Watch Instead
- 1. Net Interest Margin (NIM)
- 2. PPOP: Pre-Provision Operating Profit
- 3. Credit Costs
- 4. Return On Assets (ROA)
- 5. Return On Equity (ROE)
- 6. Asset Quality
- Bank / NBFC Metrics At A Glance
- How Should Investors Value A Bank Or NBFC?
- Why EV/EBITDA Is Usually Not The Starting Point
- A Practical Example: Two Lenders, Same EBITDA, Different Value
- Five Common Mistakes Investors Make When Analysing Lenders
- Mistake 1: Comparing EBITDA Margins Across Sectors
- Mistake 2: Ignoring Credit Cost Because Operating Profit Looks Strong
- Mistake 3: Looking At ROE Without Understanding Leverage And Asset Quality
- Mistake 4: Treating Loan Growth As Automatically Positive
- Mistake 5: Applying An Industrial-Company Valuation Template
- A 10-Question Investor Checklist For Banks & NBFCs
- What This Means For Founders And Management Teams
- Frequently Asked Questions (FAQs)
- 1. Why is EBITDA not the right metric for banks?
- 2. Is EBITDA useful for NBFC valuation?
- 3. What metrics are used to evaluate banks and NBFCs?
- 4. Why does EBITDA work differently across industries?
- 5. What is a better alternative to EBITDA for financial businesses?
- 6. Can EBITDA still provide any information about financial businesses?
- The Bottom Line
- Final Thought For Investors
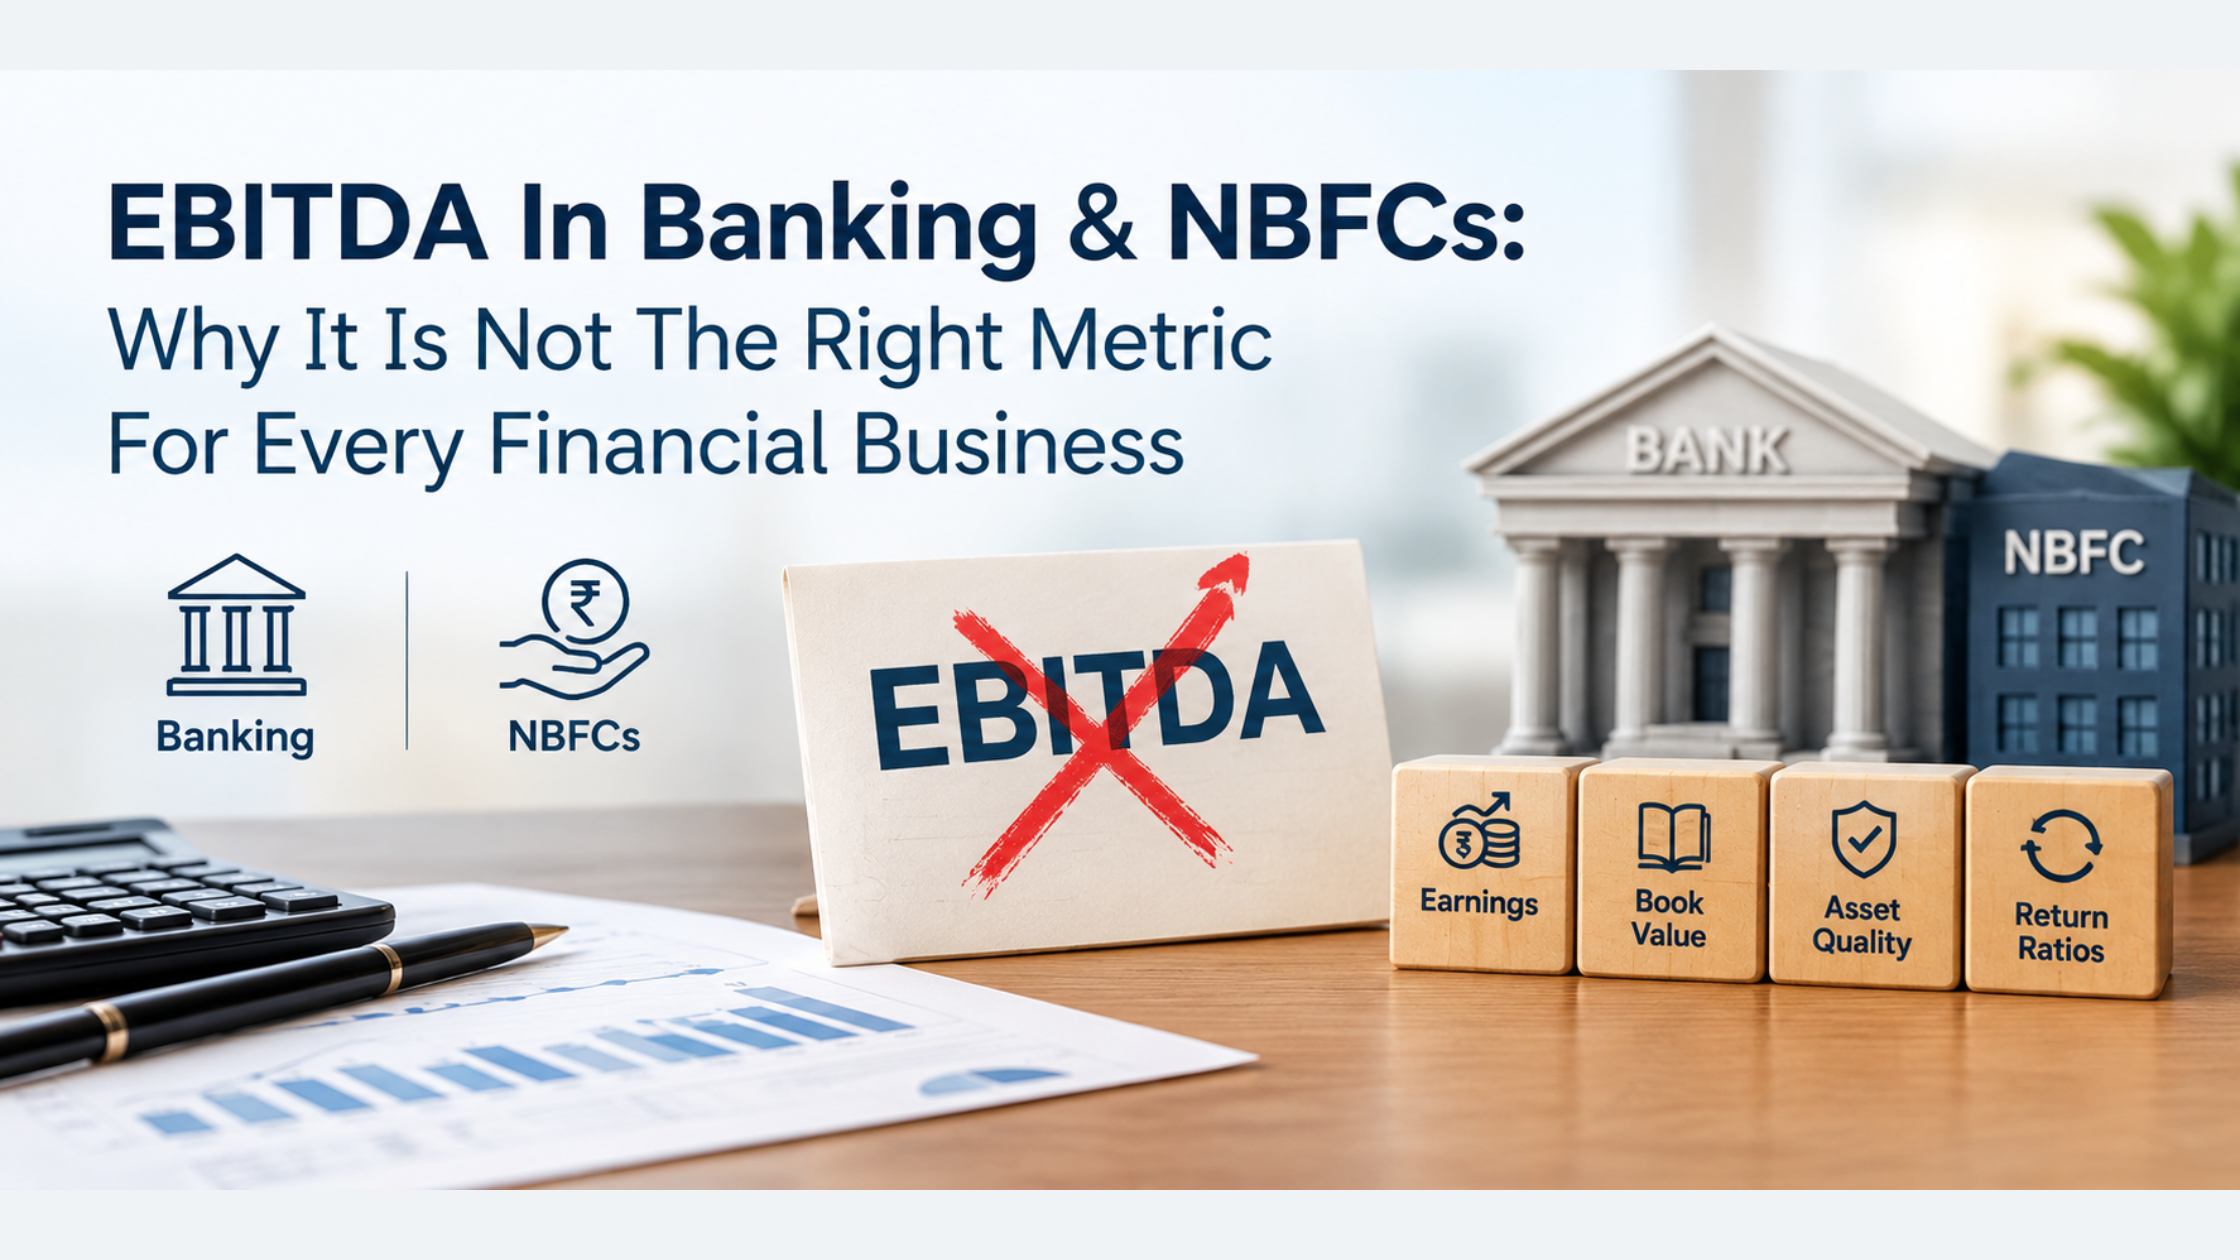
EBITDA in Banking and NBFCs requires a different perspective because traditional EBITDA analysis may not fully reflect how financial businesses operate. Unlike conventional companies, banks and NBFCs rely heavily on interest income, borrowing costs, credit quality, provisions, and regulatory capital. As a result, EBITDA may not always provide a meaningful picture of profitability or operational performance. This blog explains why EBITDA has limitations when evaluating financial institutions and highlights alternative metrics such as Net Interest Margin (NIM), Return on Assets (ROA), Return on Equity (ROE), asset quality, credit costs, and capital adequacy. Understanding these measures enables more relevant financial analysis and valuation.
Why investors analyse a lender differently from a manufacturing company
A practical corporate finance guide to understanding NIM, PPOP, credit costs, ROA, ROE and asset quality, and why applying a conventional EBITDA framework to a lender can lead to the wrong conclusions.
The EBITDA Question That Can Mislead An Investor
EBITDA is one of the most familiar financial metrics in corporate finance. It is frequently used to compare operating profitability, calculate enterprise value multiples and assess the performance of businesses such as manufacturing, logistics, technology and retail.
But there is a category error that investors, founders and even inexperienced advisors can make: taking the same EBITDA framework and applying it to a bank or NBFC without considering how a financial institution actually makes money.
For a manufacturing company, borrowing money is usually a financing decision. For a lender, raising money and deploying it into loans or other financial assets is the core operating model. Interest income is revenue, funding costs are a fundamental cost of earning that revenue, and credit losses are not an incidental expense. They are central to the economics of the business.
That is why a lender should not be analysed simply as a company with revenue, EBITDA and debt. The analytical framework needs to follow the economics of lending.
First, Understand The Business Model
Consider a conventional manufacturing company. It purchases raw materials, converts them into products, sells those products, collects receivables and reinvests in productive assets. Its operating performance can reasonably be examined through revenue, gross profit, EBITDA, EBIT and free cash flow.
A bank or NBFC works differently. It raises funds, deploys capital into financial assets, earns interest and fees, incurs funding and operating costs, and must absorb expected and unexpected credit losses while maintaining adequate capital and liquidity.
| Manufacturing company | Bank / NBFC |
| Revenue primarily comes from selling goods or services | Income primarily comes from financial assets, including interest and fees |
| Debt is generally a financing choice | Funding is integral to the operating model |
| Depreciation reflects use of physical operating assets | Credit provisions reflect the risk and expected loss characteristics of financial assets |
| Working capital is mainly inventory, receivables and payables | The balance sheet is dominated by financial assets and liabilities |
| Capex is a central cash-flow consideration | Capital adequacy, liquidity and asset-liability management are central |
| EV/EBITDA can be a useful valuation starting point | P/B and P/E are often more informative starting points |
Why Traditional EBITDA Analysis Can Be Misleading For Lenders
1. Interest Is Not Simply A Financing Cost
In a typical operating company, interest expense is generally associated with how the business is financed. An analyst can therefore look at EBITDA before interest and then separately assess leverage.
For a lender, that separation is much less meaningful. The institution earns interest because it has deployed capital into loans and investments, and it pays interest because it has raised funds to support those assets. The spread between earning assets and funding costs is a fundamental part of the business.
If an analyst focuses on EBITDA and effectively removes interest from the discussion, the analysis can lose sight of one of the lender’s most important economic drivers: the relationship between asset yields and funding costs.
2. Credit Cost Is An Economic Cost Of Lending
A lender can report strong income and operating profitability while the quality of its loan book is deteriorating. If credit losses subsequently rise, the headline operating picture can prove misleading.
Credit cost, provisioning and asset quality therefore deserve a prominent place in lender analysis. Two NBFCs with similar operating income can have very different economic value if one has better underwriting, lower delinquencies and lower credit losses.
3. Capital Adequacy Changes The Growth Equation
A lender cannot expand its loan book indefinitely simply because demand exists. Growth consumes regulatory and economic capital. The institution needs an appropriate capital cushion relative to its risk-weighted assets and overall risk profile.
Consequently, investors should ask not only how fast the loan book can grow, but how much equity capital is required to support that growth and what return the lender earns on that capital.
4. The Balance Sheet Is The Operating Engine
For a manufacturing business, the income statement often provides the first view of operating performance. For a bank or NBFC, the balance sheet is inseparable from the income statement.
The composition and quality of loans, investments, borrowings and other liabilities directly affect future income, funding costs, liquidity and losses. An apparently attractive profit number is less useful if it has been generated by taking risks that are not adequately compensated.
The Metrics Investors Should Watch Instead
1. Net Interest Margin (NIM)
NIM measures the spread earned on interest-earning assets after considering the associated interest cost, expressed relative to the relevant earning-asset base. It is one of the key indicators of the economics of lending.
A higher NIM can indicate stronger pricing power, a favourable product mix or lower funding costs, but a high NIM is not automatically better. An unusually high spread may sometimes reflect higher-risk lending. Investors should therefore read NIM together with asset quality and credit costs.
- Is NIM stable or expanding?
- What is driving the movement in NIM?
- Is the improvement coming from asset yields, funding costs or product mix?
- Does the margin remain attractive after credit costs?
2. PPOP: Pre-Provision Operating Profit
Pre-Provision Operating Profit, commonly abbreviated as PPOP, looks at operating profitability before provisions for credit losses. It helps investors understand how much operating profit the lender generates before absorbing the cost of credit risk.
PPOP is useful because it separates two important questions: how efficiently is the institution operating, and how much of that operating profit is being consumed by credit losses?
However, PPOP should never be treated as the final answer. A lender with excellent PPOP but weak underwriting can still produce poor long-term shareholder returns once credit costs rise.
3. Credit Costs
Credit cost reflects the economic burden associated with loan losses and provisions. It is one of the most important bridges between a lender’s operating performance and its sustainable profitability.
- Trend in provisioning and credit costs.
- Movement in delinquencies and stressed assets.
- Recovery performance and write-offs.
- Credit costs by product or borrower segment where disclosed.
- Whether rapid loan growth is being accompanied by deterioration in underwriting quality.
The central investor question is simple: is the lender earning a healthy spread because it is genuinely efficient, or because it is temporarily underpricing risk?
4. Return On Assets (ROA)
ROA measures profit relative to the asset base and helps investors assess how efficiently a financial institution converts its assets into earnings.
ROA is particularly useful when comparing lenders because it brings the scale of the balance sheet into the analysis. A lender may grow its assets rapidly, but if the additional assets generate weak returns or require disproportionately high credit provisions, growth may not create value.
5. Return On Equity (ROE)
ROE measures the return generated on shareholders’ equity. For financial institutions, this is a critical metric because equity capital is a scarce resource that supports balance-sheet growth and absorbs losses.
An investor should look at both the level and sustainability of ROE. A high ROE can be attractive, but it may be accompanied by greater leverage or risk. A sustainable ROE supported by sound asset quality and disciplined capital management is more valuable than a temporarily elevated ROE created by aggressive risk-taking.
6. Asset Quality
Asset quality is where the accounting story meets the credit story. Investors should understand the health of the loan book, including delinquency trends, non-performing assets where applicable, restructurings, write-offs and recoveries.
Asset quality also needs to be analysed by product, geography, borrower segment and vintage when the disclosures permit. A stable headline NPA ratio can conceal emerging stress if risk is concentrated in a fast-growing portfolio.
Bank / NBFC Metrics At A Glance
| Metric | What it helps answer | What it should be read with |
| NIM | How attractive is the lender’s interest spread? | Funding costs, asset yields, product mix, asset quality |
| PPOP | How strong is operating profitability before credit provisions? | Operating expenses, NIM, credit costs |
| Credit cost | How much of operating profit is consumed by credit losses? | Delinquencies, NPAs, recoveries, underwriting |
| ROA | How efficiently does the asset base generate profit? | Loan mix, credit costs, growth and risk |
| ROE | What return is generated on shareholder capital? | Capital adequacy, leverage, ROA and growth |
| Asset quality | How healthy is the loan book? | Product mix, vintage, provisioning and recoveries |
How Should Investors Value A Bank Or NBFC?
Once the operating economics are understood, valuation becomes much more meaningful. The objective is to estimate what the institution’s future earnings and capital can generate, adjusted for risk.
Price-To-Book (P/B)
P/B is widely used for financial institutions because book equity is a core part of the economic and regulatory framework of a lender. But the book value should not be considered in isolation. Investors need to assess the quality of the asset base and the institution’s ability to generate returns on that equity.
Price-To-Earnings (P/E)
P/E can be useful where earnings are reasonably normalised and the lender has a stable profitability profile. The quality and sustainability of those earnings remain critical, especially where credit costs can change materially through the cycle.
DCF And Other Cash-Flow Frameworks
Discounted cash-flow approaches can be applied to financial institutions, but the modelling framework needs to reflect financial-sector economics. For lenders, analysts often focus on distributable earnings, capital requirements and the amount of capital that can be returned while still supporting prudent growth.

Why EV/EBITDA Is Usually Not The Starting Point
Enterprise value and EBITDA are most intuitive for operating businesses where debt is a financing claim and EBITDA approximates operating earnings before financing and non-cash charges.
For banks and many NBFCs, debt-like funding is intertwined with the assets that generate income. Treating borrowings as though they were simply optional corporate leverage can distort the economic picture.
That does not mean every EBITDA-related analysis is mathematically impossible. It means that EV/EBITDA should not be the default valuation lens simply because the company has a reported EBITDA figure.
A Practical Example: Two Lenders, Same EBITDA, Different Value
Imagine two hypothetical NBFCs that appear similar on a conventional income statement. Both show strong operating income and similar EBITDA-style profitability.
| Indicator | Lender A | Lender B |
| NIM | Stable | Higher but volatile |
| PPOP | Strong | Strong |
| Credit cost | Low and stable | Rising |
| Asset quality | Stable | Deteriorating |
| ROA | Consistent | Under pressure |
| ROE | Sustainable | High but riskier |
| Loan growth | Measured | Aggressive |
A superficial EBITDA comparison could conclude that the lenders are equally attractive. A lender-specific analysis would not. Lender A may deserve the stronger valuation because its earnings are supported by more stable asset quality and more sustainable returns. Lender B’s higher apparent profitability may be compensation for greater credit and balance-sheet risk.
Manufacturing Vs Banking/NBFC: The Investor’s Mental Model
| Question | Manufacturing | Bank / NBFC |
| What is the core operating asset? | Plant, machinery, inventory and operating infrastructure | Loan book and financial assets |
| What drives revenue? | Volume, price, product mix | Loan yields, fees, asset mix and balances |
| What is a major operating risk? | Demand, input costs, capacity and execution | Credit, funding, liquidity and regulation |
| What does debt represent? | Primarily financing | A core source of operating funding |
| What can destroy earnings quickly? | Margin compression or volume decline | Credit losses, funding pressure or asset-quality deterioration |
| Useful return metric | ROCE / ROIC | ROA / ROE |
| Common valuation starting point | EV/EBITDA / EV/EBIT | P/B / P/E |
Five Common Mistakes Investors Make When Analysing Lenders
Mistake 1: Comparing EBITDA Margins Across Sectors
A 20% EBITDA margin in a lender is not economically equivalent to a 20% EBITDA margin in a manufacturer. The underlying revenue and funding structures are different.
Mistake 2: Ignoring Credit Cost Because Operating Profit Looks Strong
Credit risk is part of the lender’s core business. A strong pre-provision profit can be overwhelmed by higher provisions.
Mistake 3: Looking At ROE Without Understanding Leverage And Asset Quality
ROE should be decomposed into the return generated by assets, the level of leverage and the risks taken to achieve that return.
Mistake 4: Treating Loan Growth As Automatically Positive
Growth creates value only when incremental assets generate adequate risk-adjusted returns and can be funded prudently.
Mistake 5: Applying An Industrial-Company Valuation Template
The valuation framework should reflect the lender’s balance sheet, capital requirements, risk profile and sustainable returns rather than mechanically importing EV/EBITDA.
A 10-Question Investor Checklist For Banks & NBFCs
- What is driving NIM, and is the movement sustainable?
- How has PPOP changed relative to operating expenses and income?
- What is the trend in credit costs through the cycle?
- Are asset-quality indicators improving or deteriorating?
- How are provisions, write-offs and recoveries behaving?
- What is the lender’s ROA, and what is driving it?
- Is ROE sustainable after considering capital requirements and risk?
- How quickly is the loan book growing, and is underwriting quality keeping pace?
- What are the key funding, liquidity and asset-liability risks?
- Which valuation metric and peer set best reflect this lender’s economics?

What This Means For Founders And Management Teams
If you are raising capital, preparing for a strategic transaction or evaluating the value of a financial business, the quality of the financial narrative matters as much as the headline profit.
- Present NIM and its underlying drivers clearly.
- Explain PPOP and operating-cost trends.
- Show the history and normalised level of credit costs.
- Provide transparent asset-quality indicators and provisioning coverage where relevant.
- Explain capital adequacy and the capital required to support planned growth.
- Track ROA and ROE over multiple periods rather than highlighting a single year.
- Segment performance by product, borrower type or geography when it improves transparency.
- Avoid using a valuation metric simply because it is familiar to non-financial businesses.
For an investor, the objective is not merely to identify how profitable the lender appears today. It is to understand whether today’s profitability can be sustained while the institution grows without taking unacceptable credit, funding or capital risk.
Frequently Asked Questions (FAQs)
1. Why is EBITDA not the right metric for banks?
EBITDA is generally unsuitable for banks because interest income and interest expenses are core parts of their business model.
2. Is EBITDA useful for NBFC valuation?
EBITDA is usually not the primary valuation metric for NBFCs. Investors focus more on earnings, book value, asset quality and returns.
3. What metrics are used to evaluate banks and NBFCs?
Common metrics include Net Interest Margin (NIM), Return on Equity (ROE), Return on Assets (ROA), book value, asset quality and net interest income.
4. Why does EBITDA work differently across industries?
EBITDA’s usefulness depends on the business model, particularly how revenue, financing costs and operating expenses are generated.
5. What is a better alternative to EBITDA for financial businesses?
Investors generally use industry-specific measures such as earnings, P/B ratios, ROE, NIM and asset-quality indicators.
6. Can EBITDA still provide any information about financial businesses?
It may provide limited operational information in certain contexts, but it should not be treated as the primary measure of profitability or valuation for banks and NBFCs.
The Bottom Line
EBITDA is a powerful corporate finance tool, but it is not a universal language for every business model. For banks and NBFCs, traditional EBITDA analysis can remove precisely the items that explain how lending economics work.
A better lender analysis starts with NIM and PPOP, moves through credit costs and asset quality, and then evaluates ROA, ROE, capital and liquidity. Only after understanding these drivers should an investor decide which valuation framework and peer multiple make sense.
The key lesson is simple: a lender should be valued according to the economics of lending, not according to a template designed for manufacturing.
Final Thought For Investors
When comparing businesses, never ask only, ‘How much EBITDA does this company make?’ Ask, ‘What does this EBITDA represent, what capital supports it, what risks sit behind it, and how does the business convert that economic activity into sustainable shareholder returns?’
Editorial Note
This article is an educational corporate finance analysis. Specific bank and NBFC valuations should be based on the institution’s financial statements, regulatory disclosures, asset-quality profile, capital position, funding structure, peer set, growth outlook and transaction context.

 Blog
Blog
Healthcare Industry in India: Investment & Growth Opportunities
India’s healthcare sector is entering a new phase of formalisation, consolidation and capital-driven growth. The market is estimated…
Rathandeep U
Read
 Blog
Blog
Feasibility Study In Business: A Complete Guide For Indian SMEs & Family Businesses
A feasibility study is essential for making informed business decisions, especially for Indian SMEs and family-owned businesses. A…
Rathandeep U
Read
 Blog
Blog
How To Write A Funding Pitch: A Complete Guide For Indian SMEs & Family Businesses
How to Write a Funding Pitch is an essential skill for Indian SMEs and family businesses seeking investors,…
Rathandeep U
Read